
As the summer break draws to a close we thought it would be interesting to see if history can shed any light on the likely outcome of the 2017 F1 Drivers Championship.
We began by reconstructing the midseason standings for all prior seasons back to 1950. A couple of things are interesting to note on a first pass through the data.
At the moment Sebastian Vettel is leading the championship by 14 points – but of course drivers leading at the mid-season point don’t always win the title.
So how likely is it that Lewis Hamilton, Valtteri Bottas or someone else could overcome the deficit to beat Vettel?
Below is the top ten second-half comebacks: drivers who trailed at mid-season and went on to win the championship, along with the points difference they had to make up.
| Rank | Driver | Year | Mid-Season Points | Mid-Season Deficit |
|---|---|---|---|---|
| 1 | Vettel | 2012 | 110 | -44 |
| 2 | Hunt | 1976 | 26 | -26 |
| 3 | Vettel | 2010 | 121 | -24 |
| 4 | Surtees | 1964 | 10 | -20 |
| 5 | Räikkönen | 2007 | 52 | -18 |
| 6 | Hamilton | 2014 | 176 | -14 |
| 7 | Rosberg | 1982 | 17 | -13 |
| 8 | Lauda | 1984 | 24 | -12 |
| 9 | Piquet | 1981 | 26 | -11 |
| 10 | Senna | 1988 | 48 | -6 |
As we can see, Vettel himself is the driver who has overcome the biggest deficit to win it – his 44 point recovery in 2012 takes the prize there.
Another interesting point to note is that Hamilton at number six on the list won the 2014 season after trailing by 14 points at mid-season. Why is this interesting? Because Hamilton currently trails Vettel by exactly 14 points in 2017. Lewis will be hoping history repeats!
Hang on, this is not a fair fight, you say. The point system was completely different for some of those earlier years so we’re not comparing apples with apples. Quite right. Here is the top 10 comebacks based on the current points system applied to all historical seasons.
| Rank | Driver | Year | Mid-Season Points | Mid-Season Deficit |
|---|---|---|---|---|
| 1 | Hunt | 1976 | 78 | -73 |
| 2 | Lauda | 1984 | 68 | -58 |
| 3 | Vettel | 2012 | 110 | -44 |
| 4 | Rosberg | 1982 | 58 | -41 |
| 5 | Räikkönen | 2007 | 131 | -36 |
| 6 | Piquet | 1981 | 80 | -34 |
| 7 | Vettel | 2010 | 121 | -24 |
| 8 | Villeneuve | 1997 | 112 | -21 |
| 9 | Senna | 1988 | 136 | -18 |
| 10 | Piquet | 1983 | 85 | -18 |
This really puts Hunt’s 1976 triumph into perspective, although it did take some exceptional circumstances for him to win from such a deficit. So exceptional in fact that they made a feature film about the season!
And the plot thickens. Hunt’s fellow protagonist in 1976, the inimitable Niki Lauda, managed to turn the tables nearly a decade later to pull off his own lazarus-like recovery to claim his third World Drivers Championship in 1984.
But back to the analysis – and a quick note: from this point on we exclude seasons prior to 1974 as the number of races per season was significantly lower than today making comparisons more difficult.
In the next step we “bucket” the results to group drivers who had similar positions at mid-season.
For example, the (-30, -20) bucket in the graph below includes all drivers in all seasons (since 1974) who were trailing the leader by between 20 and 30 points at mid-season. Similarly, the (40, 50) bucket includes all drivers in all seasons (since 1974) who were leading the championship at mid-season by between 40 and 50 points.
Next, we check to see the proportion of drivers from each bucket who went on to win the championship. The results are presented in the chart below.

As you would expect the drivers with significant points leads at mid-season (buckets towards the right in the chart above) went on to win the championship fairly often.
Those trailing the leader at mid-season (towards the left of the chart) sometimes still manage to win but the frequency for these buckets is understandably lower. So far so good.
As you can see the relationship isn’t perfect but there is an unmistakable upward slope that is consistent with expectations.
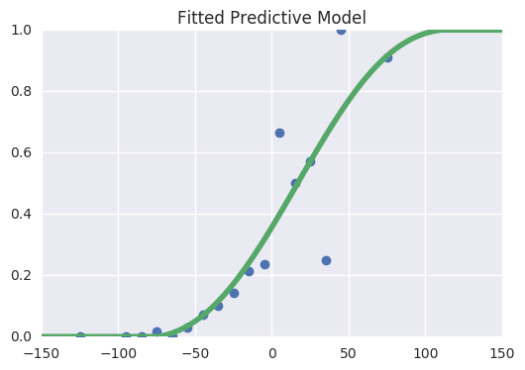
In order to allow us to make specific predictions for the 2017 season, we fit a curve to this data to create a prediction model.
The fitted prediction model is presented below (the green line). Once again, a positive number on the x-axis refers to a points lead at mid-season while a negative number refers to a points deficit (ie, trailing the leader).
For a given relative points position at mid-season we can now estimate the likelihood that a driver will go on to win the championship.
Finally we map this model to the current mid-season points standings for 2017 to arrive at an estimate of the probability that each driver will win the 2017 championship.
The results are presented below. For context we’ve overlaid the probabilities implied by the mid-market prices from Betfair at the time of writing.

Interestingly Hamilton is favoured on Betfair despite trailing Vettel by 14 points at mid-season.
As a result there is evidence of under-pricing of both Vettel and Bottas relative to our historical probability model.
So what does this tell us?
SEBASTIAN VETTEL
The analysis suggests Vettel has a 56% chance of victory – but Betfair only give him a 40% chance.
LEWIS HAMILTON
Hamilton has a 29% chance of victory based on the data, while Betfair give him a much more generous 54% chance.
VALTTERI BOTTAS
Bottas’ chances of taking the title look pretty slim at just 15%, with Betfair even more miserly at just 5%.
WHAT ABOUT THE REST?
All other drivers are effectively out of the hunt at this stage in the Championship. Although we’d secretly love to see Ricciardo knock James Hunt off his perch for the biggest comeback in Formula 1 history.
So are the punters on Betfair right to ignore the historical record? The jury is out.
Perhaps the betting market is efficiently pricing a range of factors specific to 2017 that our historical analysis just can’t capture.
Or perhaps the F1 betting market is just a popularity contest and punters ignore history at their peril?
Only one way to find out. Get set for the second half of a great 2017 season!